There can only be one winner in the Super Bowl, read our guide to see who will it and why?
The 2013 NFL season has already produced some of the best highlights, stunning plays and amazing statistics ever seen by American Football fans.
However, with countdown to the playoffs and the Super Bowl well underway, fanatix looks at who is leading the pack and who will have to rely on a lot of luck to make it to the big dance.
All Stats correct as of November 30, 2013
10. Baltimore Ravens
Team stats 2013-14
Points: 20.8 (24th in league)
Yards: 309.8 (29th)
Pass yards: 227.9 (19th)
Rush yards 81.1 (28th)
Complete Team stats – Baltimore v 2013-14 opponents
| Total First Downs | 218 | 208 |
| 1st Downs (Rush-Pass-By Penalty) | 53 – 136 – 29 | 56 – 131 – 21 |
| 3rd Down Conversions | 73/194 | 58/177 |
| 4th Down Conversions | 5/8 | 7/13 |
| Total Offensive Yds | 3708 | 3948 |
| Offense (Plays-Avg Yds) | 811 – 4.6 | 778 – 5.1 |
| Total Rushing Yds | 973 | 1201 |
| Rushing (Plays-Avg Yards) | 333 – 2.9 | 323 – 3.7 |
| Total Passing Yds | 2735 | 2747 |
| Passing (Comp-Att-Int-Avg) | 262 – 439 – 14 – 6.8 | 244 – 418 – 9 – 7.1 |
| Sacks | 37 | 39 |
| Field Goals | 29/31 | 25/28 |
| Touchdowns | 23 | 23 |
| (Rush-Pass-Ret-Def) | 6 – 15 – 1 – 1 | 2 – 19 – 0 – 2 |
| Time of Possession | 30:58 | 30:20 |
| Turnover Ratio | -3 | |
They have still got a long way to got to be worthy of a playoff contender that, rather than just simply making up the numbers, but last year’s fairytale story of the league is starting to show signs of improvement.
The offence is their biggest concerns as they have had to deal with plenty of turnover from their Superbowl winning season last year.
But it is possible for them to turn around and make the above stats, and their 6-6 record, look below average if they can get momentum and go on a late season run.
9. Detroit Lions
Team stats 2013-14
Points: 27.2 (6th in league)
Yards: 424.5 (2nd)
Pass yards: 309.2 (3rd)
Rush yards: 115.2 (15th)
Complete team stats – Detroit Lions v 2013-14 opponents
| Total First Downs | 282 | 215 |
| 1st Downs (Rush-Pass-By Penalty) | 83 – 180 – 19 | 37 – 153 – 25 |
| 3rd Down Conversions | 73/161 | 48/157 |
| 4th Down Conversions | 4/12 | 6/8 |
| Total Offensive Yds | 5094 | 4139 |
| Offense (Plays-Avg Yds) | 841 – 6.1 | 733 – 5.6 |
| Total Rushing Yds | 1382 | 992 |
| Rushing (Plays-Avg Yards) | 326 – 4.2 | 269 – 3.7 |
| Total Passing Yds | 3712 | 3147 |
| Passing (Comp-Att-Int-Avg) | 296 – 500 – 14 – 7.7 | 264 – 437 – 12 – 7.7 |
| Sacks | 27 | 15 |
| Field Goals | 15/20 | 28/31 |
| Touchdowns | 40 | 29 |
| (Rush-Pass-Ret-Def) | 11 – 27 – 0 – 2 | 5 – 21 – 0 – 3 |
| Time of Possession | 32:12 | 27:47 |
| Turnover Ratio | -8 | |
The Lions earned an important win over the Green Bay Packers on Thanksgiving to give them a 7-5 record to date on the year, with the win over the Aaron Rodgers-less Packers potentially a launching pad for the side.
With Matthew Stafford at quarterback combining well with Reggie Bush on the ground and Calvin Johnson through the air, the Lions have the offence to trouble many sides in the playoffs if they can put it together.
But can their defence ensure they don’t need to score more than 30 points every game to stay competitive.
8. Indianapolis Colts
Team stats 2013-14
Points: 23.9 (16th in league)
Yards: 339.8 (14th)
Pass yards: 229.9 (18th)
Rush yards: 109.9 (19th)
Complete team stats – Indianapolis Colts v 2013-14 opponents
| Total First Downs | 218 | 218 |
| 1st Downs (Rush-Pass-By Penalty) | 64 – 130 – 24 | 66 – 135 – 17 |
| 3rd Down Conversions | 55/140 | 58/146 |
| 4th Down Conversions | 0/6 | 4/10 |
| Total Offensive Yds | 3738 | 4060 |
| Offense (Plays-Avg Yds) | 692 – 5.4 | 696 – 5.8 |
| Total Rushing Yds | 1209 | 1381 |
| Rushing (Plays-Avg Yards) | 274 – 4.4 | 316 – 4.4 |
| Total Passing Yds | 2529 | 2679 |
| Passing (Comp-Att-Int-Avg) | 230 – 394 – 8 – 6.8 | 215 – 351 – 8 – 8.1 |
| Sacks | 29 | 24 |
| Field Goals | 21/24 | 21/27 |
| Touchdowns | 28 | 28 |
| (Rush-Pass-Ret-Def) | 11 – 15 – 0 – 2 | 9 – 16 – 1 – 2 |
| Time of Possession | 29:13 | 30:46 |
| Turnover Ratio | +3 | |
While their overall statistics do not look all that flattering on the surface, the Lions behind Andrew Luck at quarter-back have shown how to win games this season.
Their 7-4 record might not strike fear into the heart of every team that is bound for the playoffs, but whoever draws the Colts will know they will be in for a tough night at the office.
7. San Francisco 49ers
Team stats
Points: 24.9 (10th in league)
Yards: 309.5 (30th)
Pass yards: 173.5 (32nd)
Rush yards: 135.1 (4th)
Complete team stats – San Francisco 49ers v 2013-14 opponents
| Total First Downs | 186 | 195 |
| 1st Downs (Rush-Pass-By Penalty) | 80 – 93 – 13 | 63 – 113 – 19 |
| 3rd Down Conversions | 55/149 | 54/158 |
| 4th Down Conversions | 7/10 | 6/14 |
| Total Offensive Yds | 3394 | 3428 |
| Offense (Plays-Avg Yds) | 651 – 5.2 | 712 – 4.8 |
| Total Rushing Yds | 1486 | 1152 |
| Rushing (Plays-Avg Yards) | 349 – 4.3 | 294 – 3.9 |
| Total Passing Yds | 1908 | 2276 |
| Passing (Comp-Att-Int-Avg) | 157 – 276 – 7 – 7.4 | 228 – 391 – 12 – 6.3 |
| Sacks | 27 | 26 |
| Field Goals | 16/19 | 14/17 |
| Touchdowns | 32 | 20 |
| (Rush-Pass-Ret-Def) | 15 – 14 – 0 – 3 | 9 – 11 – 0 – 0 |
| Time of Possession | 29:41 | 30:18 |
| Turnover Ratio | +6 | |
It says something about how good a season Frank Gore is having for the 49ers that he has almost single handily kept his side in the hunt to cause some havoc in the playoffs.
Gore has 779 yards on 188 carries so far this season, at an average of 4.1 yards for seven touchdowns, which has helped balance out the side’s poor passing game which sees them ranked a lowly 32nd in the league, with Colin Kaepernick only hitting his targets 56 per cent of the time.
6. Cincinnati Bengals
Team stats
Points: 25.0 (9th in league)
Yards: 364.5 (10th)
Pass yards: 256. (10th)
Rush yards: 107.9 (21st)
Complete team stats – Cincinnati Bengals v 2013-14 opponents
| Total First Downs | 219 | 196 |
| 1st Downs (Rush-Pass-By Penalty) | 63 – 140 – 16 | 52 – 121 – 23 |
| 3rd Down Conversions | 61/160 | 60/168 |
| 4th Down Conversions | 7/13 | 3/10 |
| Total Offensive Yds | 4010 | 3444 |
| Offense (Plays-Avg Yds) | 756 – 5.3 | 745 – 4.6 |
| Total Rushing Yds | 1187 | 1122 |
| Rushing (Plays-Avg Yards) | 319 – 3.7 | 282 – 4.0 |
| Total Passing Yds | 2823 | 2322 |
| Passing (Comp-Att-Int-Avg) | 253 – 411 – 15 – 7.2 | 247 – 429 – 12 – 5.9 |
| Sacks | 34 | 26 |
| Field Goals | 15/19 | 19/23 |
| Touchdowns | 33 | 21 |
| (Rush-Pass-Ret-Def) | 7 – 21 – 0 – 5 | 4 – 14 – 0 – 3 |
| Time of Possession | 32:21 | 30:01 |
| Turnover Ratio | -2 | |
Andy Dalton and the Bengals have built their solid record off the back of the side’s excellent defence which has been one of the best in the league for most of the season.
A small but important sign of this is their 34 sacks this season, with their pass rush defence causing havoc against teams with less than solid offensive lines.
5. New Orleans Saints
Team stats
Points: 27.7 (3rd in league)
Yards: 415 (3rd)
Pass yards: 317.5 (3rd)
Rush yards: 97.7 (23rd)
Complete team state – New Orleans Saints v 2013-14 opponents
| Total First Downs | 252 | 190 |
| 1st Downs (Rush-Pass-By Penalty) | 64 – 168 – 20 | 58 – 119 – 13 |
| 3rd Down Conversions | 67/148 | 46/134 |
| 4th Down Conversions | 4/10 | 1/6 |
| Total Offensive Yds | 4565 | 3409 |
| Offense (Plays-Avg Yds) | 739 – 6.2 | 652 – 5.2 |
| Total Rushing Yds | 1075 | 1231 |
| Rushing (Plays-Avg Yards) | 277 – 3.9 | 256 – 4.8 |
| Total Passing Yds | 3490 | 2178 |
| Passing (Comp-Att-Int-Avg) | 300 – 439 – 8 – 8.3 | 211 – 359 – 10 – 6.7 |
| Sacks | 37 | 23 |
| Field Goals | 20/26 | 16/19 |
| Touchdowns | 35 | 21 |
| (Rush-Pass-Ret-Def) | 7 – 28 – 0 – 0 | 9 – 11 – 0 – 1 |
| Time of Possession | 33:03 | 26:56 |
| Turnover Ratio | +4 | |
As it has for the past few season, the Saints’ Superbowl dreams live and die on the arm of Drew Brees.
Brees has again shown this season why he is one of the best quarterbacks of the past 10 years on his way to 3647 yards at 68 per cent with 28 touchdowns and a rating of 107.3.
4. Kansas City Chiefs
Team stats
Points: 24.5 (11th in league)
Yards: 326.8 (22nd)
Pass yards: 206.0 (26th)
Rush yards: 120.8 (13th)
Complete team stats – Kansas City Chiefs v 2013-14 opponents
| Total First Downs | 217 | 201 |
| 1st Downs (Rush-Pass-By Penalty) | 68 – 126 – 23 | 58 – 130 – 13 |
| 3rd Down Conversions | 56/158 | 44/151 |
| 4th Down Conversions | 0/4 | 6/13 |
| Total Offensive Yds | 3595 | 3860 |
| Offense (Plays-Avg Yds) | 728 – 4.9 | 718 – 5.4 |
| Total Rushing Yds | 1329 | 1275 |
| Rushing (Plays-Avg Yards) | 298 – 4.5 | 277 – 4.6 |
| Total Passing Yds | 2266 | 2585 |
| Passing (Comp-Att-Int-Avg) | 235 – 398 – 5 – 6.1 | 225 – 404 – 12 – 7.0 |
| Sacks | 37 | 32 |
| Field Goals | 20/23 | 15/20 |
| Touchdowns | 30 | 19 |
| (Rush-Pass-Ret-Def) | 9 – 14 – 1 – 6 | 6 – 13 – 0 – 0 |
| Time of Possession | 31:45 | 28:14 |
| Turnover Ratio | +13 | |
No matter what happens for the rest of the season, the Kansas City Chiefs have already achieved more than most expected them to this season, after going on a stunning early-season win streak through nine games.
However, either under the weight of expectations or perhaps the rest of the league is beginning to work them out, but the Chiefs have lost their last two games.
Regardless, quarterback Alex Smith, with his 2443 yards and Jamaal Charles with his 918 yards rushing and 426 receiving will keep the side ticking over.
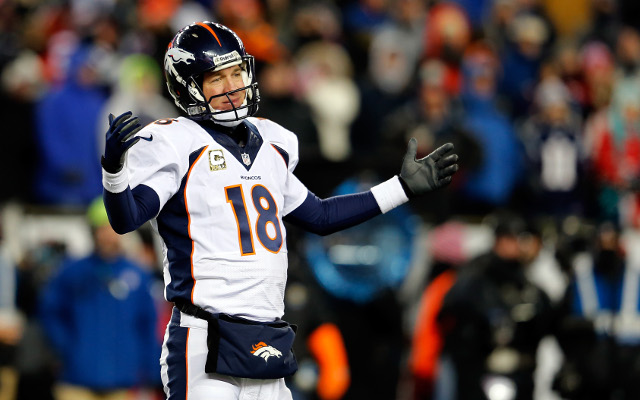
3. Denver Broncos
Team stats
Points: 39.0 (1st in league)
Yard: 451.5 (1st)
Pass yards: 330.5 (1st)
Rush yards: 121.0 (12th)
Complete team stats – Denver Broncos v 2013-14 opponents
| Total First Downs | 299 | 242 |
| 1st Downs (Rush-Pass-By Penalty) | 78 – 196 – 25 | 52 – 159 – 31 |
| 3rd Down Conversions | 69/143 | 59/155 |
| 4th Down Conversions | 4/4 | 1/9 |
| Total Offensive Yds | 4967 | 4158 |
| Offense (Plays-Avg Yds) | 803 – 6.2 | 767 – 5.4 |
| Total Rushing Yds | 1331 | 1043 |
| Rushing (Plays-Avg Yards) | 340 – 3.9 | 283 – 3.7 |
| Total Passing Yds | 3636 | 3115 |
| Passing (Comp-Att-Int-Avg) | 307 – 448 – 7 – 8.3 | 267 – 452 – 13 – 7.4 |
| Sacks | 32 | 15 |
| Field Goals | 15/16 | 19/21 |
| Touchdowns | 55 | 33 |
| (Rush-Pass-Ret-Def) | 14 – 36 – 2 – 3 | 10 – 21 – 0 – 2 |
| Time of Possession | 30:29 | 30:42 |
| Turnover Ratio | -3 | |
One player has helped re-write the record books this season – Peyton Manning.
Many questioned if Manning would ever be the same after multiple neck injuries and surgeries, but after a settling in period with the Broncos, the future Hall-of-Famer has stunned the NFL world with what he has achieved so far this season.
2. New England Patriots
Team stats
Points: 26.2 (7th in league)
Yards: 370.9 (9th)
Pass yards: 245.0 (13th)
Rush yards: 125.9 (10th)
Complete team state – New England Patriots v 2013-14 opponents
| Total First Downs | 246 | 237 |
| 1st Downs (Rush-Pass-By Penalty) | 68 – 148 – 30 | 81 – 141 – 15 |
| 3rd Down Conversions | 55/151 | 73/168 |
| 4th Down Conversions | 5/12 | 3/12 |
| Total Offensive Yds | 4080 | 3961 |
| Offense (Plays-Avg Yds) | 784 – 5.2 | 783 – 5.1 |
| Total Rushing Yds | 1385 | 1537 |
| Rushing (Plays-Avg Yards) | 323 – 4.3 | 342 – 4.5 |
| Total Passing Yds | 2695 | 2424 |
| Passing (Comp-Att-Int-Avg) | 257 – 430 – 7 – 6.7 | 228 – 407 – 13 – 6.5 |
| Sacks | 34 | 31 |
| Field Goals | 26/27 | 16/19 |
| Touchdowns | 30 | 26 |
| (Rush-Pass-Ret-Def) | 12 – 17 – 0 – 1 | 5 – 18 – 0 – 3 |
| Time of Possession | 29:45 | 32:19 |
| Turnover Ratio | +8 | |
The overall stats for the Pats don’t paint an accurate picture fo where the team is currently sitting in the lead-up to the playoffs.
After battling through their early season draw with most of their big name offensive stars out injured, Tom Brady had to make do with the targets he had in front of him.
But now they have got close to what they would call a full-strength side, New England will again be a force in the post-season this season.
1. Seattle Seahawks
Team stats
Points: 27.8 (2nd in league)
Yards: 358.5 (12th)
Pass yards: 210.5 (24th)
Rush yards 147.9 (3rd)
Complete team stats – Seattle Seahawks v 2013-14 opponents
| Total First Downs | 220 | 212 |
| 1st Downs (Rush-Pass-By Penalty) | 90 – 110 – 20 | 67 – 116 – 29 |
| 3rd Down Conversions | 55/139 | 56/148 |
| 4th Down Conversions | 4/8 | 4/9 |
| Total Offensive Yds | 3943 | 3226 |
| Offense (Plays-Avg Yds) | 673 – 5.9 | 697 – 4.6 |
| Total Rushing Yds | 1627 | 1242 |
| Rushing (Plays-Avg Yards) | 358 – 4.5 | 297 – 4.2 |
| Total Passing Yds | 2316 | 1984 |
| Passing (Comp-Att-Int-Avg) | 184 – 286 – 6 – 8.7 | 215 – 367 – 16 – 6.0 |
| Sacks | 33 | 29 |
| Field Goals | 24/25 | 18/19 |
| Touchdowns | 33 | 18 |
| (Rush-Pass-Ret-Def) | 11 – 20 – 0 – 2 | 4 – 12 – 0 – 2 |
| Time of Possession | 30:38 | 31:02 |
| Turnover Ratio | +11 | |
On paper the Seahawks are the most successful team on the season, but it remains to be seen if they can turn regular season wins into those in the playoffs.